Video: Pexels

COST SAVER PODCAST • Ep. 94

UK Air Quality and Health Costs: DEFRA vs WHO Mistakes, Hidden Bills and Smarter Choices

Hosted byAsad & Angela(AI-generated voices)
9 July 202616 min listenSeason 1 • Ep. 94

Recommended Cost Saver Partner

Sponsored Partner Alert

Concerned about air quality? Test for environmental sensitivities and save 5% on supplements when you Subscribe & Save.

We may earn a commission on purchases at no extra cost to you. While we only partner with trusted platforms through reputable affiliate networks, all services and accounts are managed directly by the provider, who will handle any customer care or account needs.
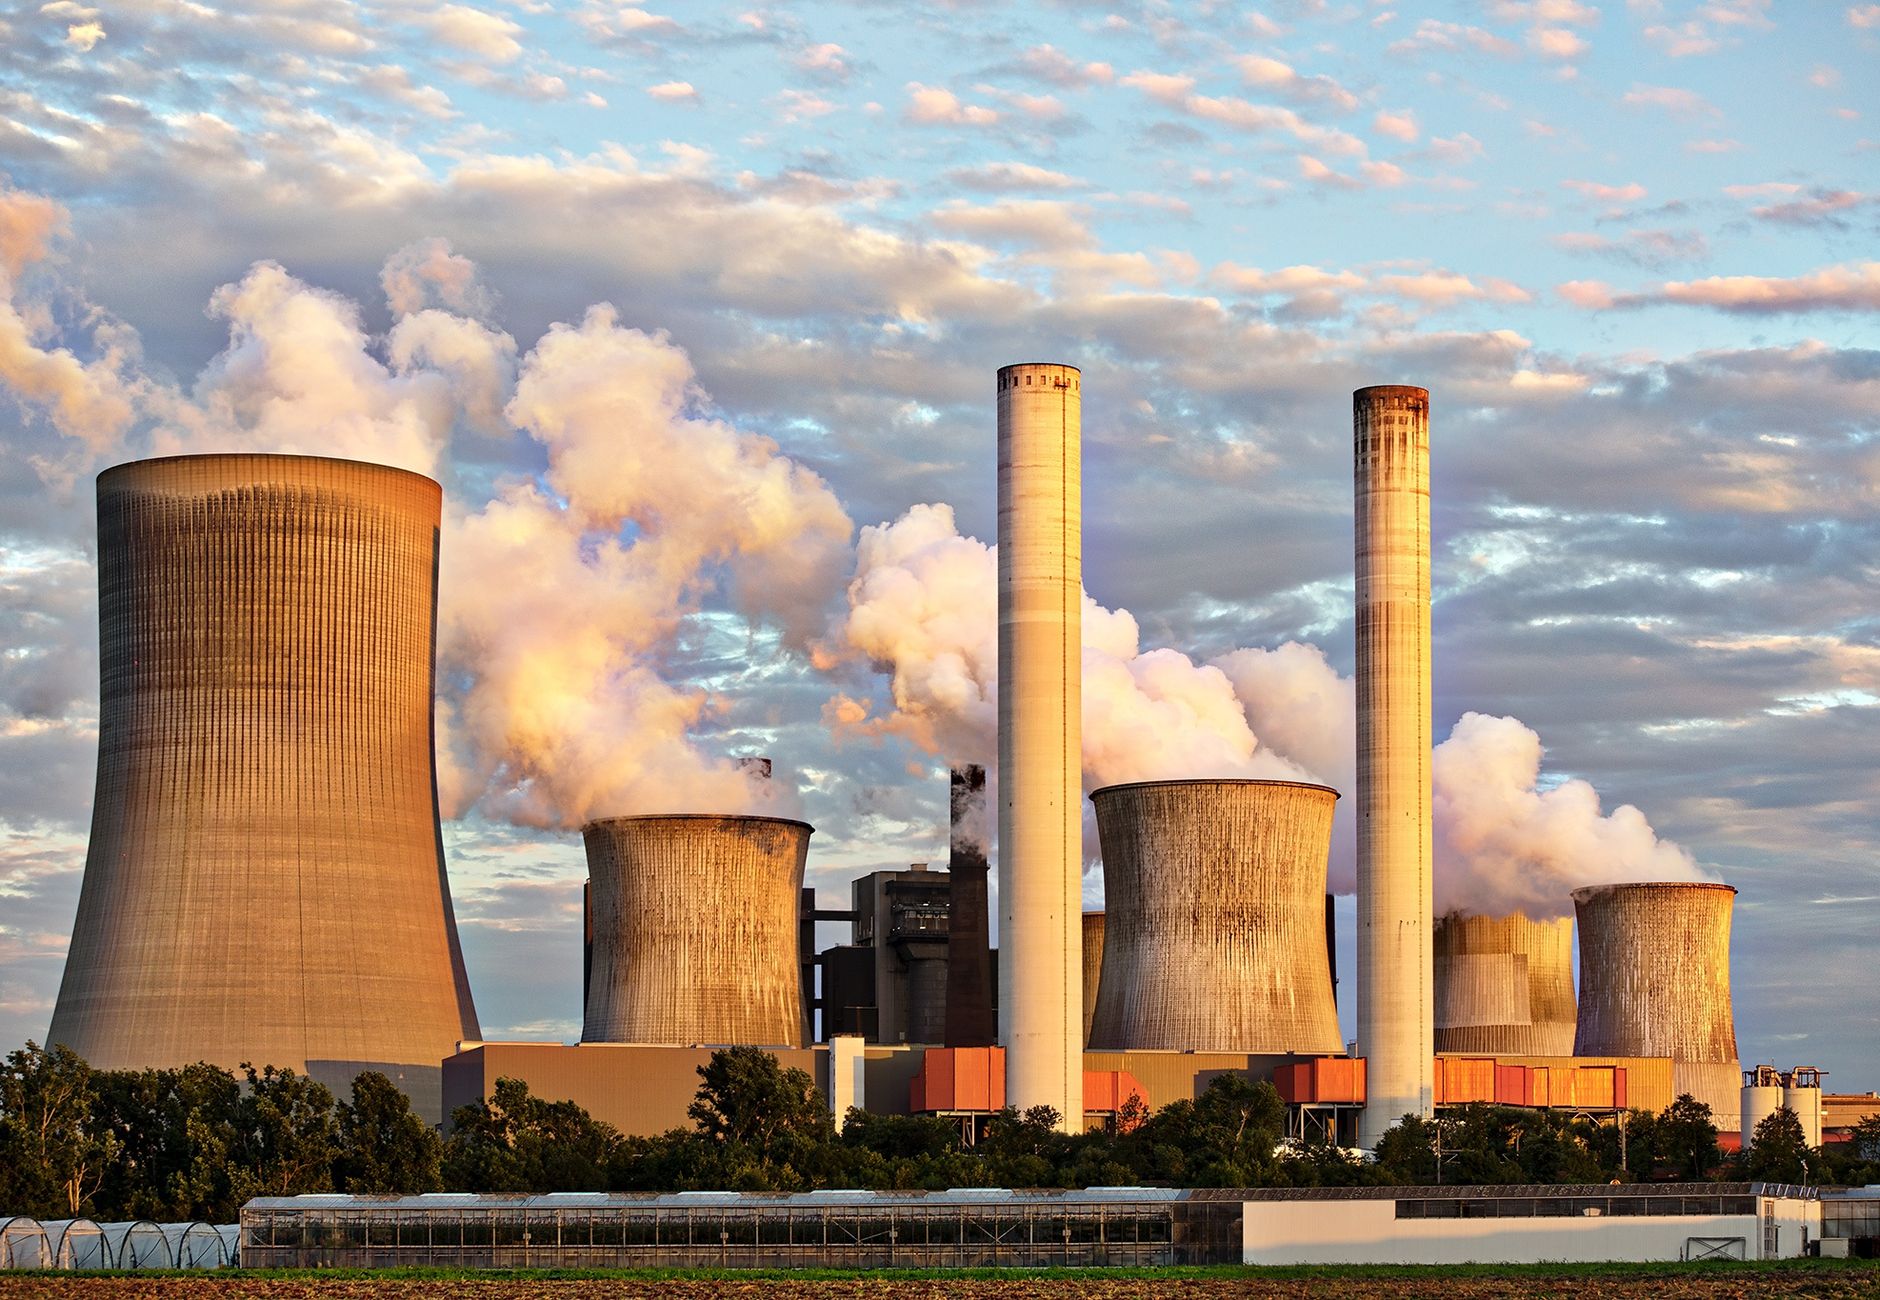
UK Air Quality and Health Costs: DEFRA vs WHO Mistakes, Hidden Bills and Smarter Choices

Now Playing · Ep. 94

UK Air Quality and Health Costs: DEFRA vs WHO Mistakes, Hidden Bills and Smarter Choices

The Cost Saver Podcast

00:000%00:00

AI-generated voices. For information only - not financial guidance.

Key moments

Key Takeaways from This Episode

  1. 1Poor air quality costs urban households £300-£900 annually in hidden health and insurance expenses.
  2. 2UK air quality standards are less stringent than WHO guidelines, leading to significant hidden health costs.
  3. 3Indoor air pollution from cooking, wood burners, and candles often exceeds outdoor levels; address it with ventilation and smart choices.
  4. 4Your car commute can expose you to more pollution than cycling; optimize routes and use recirculate mode.
  5. 5Use air quality calculators for your daily routine to identify risks and model specific changes for financial savings.

Episode Transcript

Asad & Angela — AI-generated hosts · click to collapse

v
A
AngelaWelcome to Cost Saver Conversations. I'm Angela, and I ask the practical questions so you can quickly understand what matters. Today, I'm joined by Asad. Asad: Hi Angela. We are unpacking "UK Air Quality and Health Costs: DEFRA vs WHO Mistakes, Hidden Bills and Smarter Choices" today and tying it back to the wider Cost Saver ecosystem, including tools like UK Air Quality Health-Cost Engine · DEFRA + WHO, so you can turn insights into action quickly. Angela: Just a heads-up before we dive in: we are your synthetic hosts. We are great with numbers, but as AI, we can sometimes be confidently wrong. Think of us as the digital versions of your most knowledgeable, slightly caffeinated friends. Asad: Exactly. Treat this chat as a smart estimate only, not as professional financial guidance. Always check important details with official sources or a qualified expert before making any big decisions. Angela: Asad, we're talking about air quality today, and honestly, it's one of those things I think most of us just... don't connect with our wallets? Like, at all. It feels like a big environmental thing, not a money thing. Asad: Yeah, and that — that's actually the first big mistake people make, you know? We file it under 'environment' and move on. But it's fundamentally a household budget story. Cleaner air, fewer sick days, fewer prescriptions, lower care costs down the line. And the reverse is, um, equally true. Angela: So dirtier air is basically just... quietly moving money out of your pocket into pharmacies and GP surgeries. Asad: Pretty much, yeah. And the scale is — I mean, Public Health England estimated that long-term exposure to particulate matter and nitrogen dioxide contributes to tens of thousands of equivalent deaths per year in the UK. Tens of thousands. And when you add hospital admissions, lost productivity, social care — the economic cost runs into billions annually. Angela: Billions. Wow. Asad: Yeah. Angela: But that's a national figure, right? Does it actually filter down to, like, my household? Asad: It absolutely does, and — this is the bit that gets people — the burden isn't evenly spread. A typical urban household in an Air Quality Management Area could be quietly absorbing anywhere from £300 to £900 a year in extra health, insurance, and adaptation costs compared to a rural equivalent. And most people never see the invoice. That's kind of... the whole problem. Angela: Wait — £300 to £900? Just based on where you live? Asad: Just based on where you live. Your postcode, your commute, even — and this sounds mad — even the side of the street your bedroom window faces can shift the maths meaningfully. Angela: [laughs] The side of the street! Okay. Asad: No, genuinely! There's this example — Priya from Walthamstow. She lives 30 metres from a bus corridor. She fitted a HEPA purifier, moved her toddler's bedroom to the rear of the flat, switched to a quieter cycling route — cut her family's estimated annual health-cost exposure by roughly £420. Didn't move house. Didn't spend a fortune. Angela: Oh, that's actually really reassuring. Because my first thought was 'well, what am I supposed to do, move?' Asad: Right, exactly. And most people can't just up and move. But there are things you can do, which we'll get to. First though, I think it's worth explaining why the data is so confusing, because there are basically two rulebooks. Angela: DEFRA and the WHO. Asad: Yeah. So DEFRA sets the UK's legally binding standards. Currently they're targeting 10 micrograms per cubic metre of PM2.5 as an annual mean by 2040. But that target is a policy compromise — it's balancing what's achievable against what's affordable. It is not the level at which health harms stop. Angela: Right. Asad: Whereas the WHO, their 2021 guidelines, they recommend 5 micrograms per cubic metre. Half. And that's based purely on evidence of health harm, no politics involved. So most UK urban areas sit somewhere between those two numbers — technically 'legally clean' but still causing measurable damage. Angela: So you could be in a postcode that's meeting UK targets but still, um, doubling the WHO-recommended exposure. That's— Asad: —that's exactly where the hidden costs live, yeah. And it's why people misread the data so badly. Can I walk through the common mistakes? Because I think this is where it gets really practical. Angela: Go on. Asad: Okay, so mistake one: trusting the town-level average. DEFRA publishes background maps at a 1km by 1km grid, which is fine for national policy but honestly sort of hopeless for individual decisions. Pollution near a busy junction can be double the grid average just 100 metres away. Angela: Double? Within 100 metres? Asad: Yeah. So you might think you live in 'clean' Bristol or 'clean' Leeds, but if you're near a canyon-street bus stop, the air you're actually breathing is much worse. It's the fallacy of averages. Does that make sense? Angela: It does, yeah. So what should people actually look at instead? Asad: Check the nearest monitoring station, not the grid average. Look up any Air Quality Management Area in your borough. Note the road classification within 50 metres of your front door. Even — and this one surprises people — even elevation matters. Ground-floor flats get more NO2 than fourth-floor ones. And prevailing wind direction, which in the UK is usually south-westerly, that plays a part too. Angela: Hmm. That's a lot of variables. And I suppose — well, we spend what, most of our time indoors? Is ignoring indoor air another mistake? Asad: It's a huge one. Roughly 90% of our time is spent indoors, but almost every public tool only measures outdoor concentrations. And here's the thing — cooking on gas hobs, wood burners, damp, mould, cleaning sprays, even scented candles — they can push indoor PM2.5 far above outdoor levels for hours at a time. Angela: Wait, my scented candles? [laughs] Come on. Asad: [chuckles] I know, I know. But honestly, yeah. A 'green' postcode with a wood-burning stove indoors can produce worse personal exposure than a 'red' postcode with electric heating and good ventilation. So if you're only looking at DEFRA outdoor data, you might spend money on the wrong thing — upgrading windows when you should be sorting out an extractor fan. Angela: And wood burners — I've heard they're bad but I sort of assumed the 'eco' ones were... you know, fine? Asad: Yeah, no. [sighs] Log-burning stoves are one of the largest urban sources of PM2.5 in the UK. Even DEFRA-approved 'eco' models emit far more particulates than gas central heating. Far more. It's — people don't want to hear that, but it's true. Angela: Oh. That's actually... yeah, that's not great. Okay, so there's a third mistake too, right? The daily alerts? Asad: Right, mistake three: confusing peak alerts with chronic exposure. Those daily alerts focus on short-term spikes, which matter — especially for asthmatics, older people. But the biggest lifetime cost comes from chronic, low-level exposure. A postcode that never triggers a single alert but sits at, say, 12 micrograms per cubic metre PM2.5 for years? That will still shorten average life expectancy and raise NHS costs. Angela: So people see 'low' on the daily index and think they're fine. Asad: Exactly. But that daily rating is answering a completely different question to 'what's my annual risk?' And confusing the two is how households end up under-reacting to what is, you know, a genuinely expensive problem. Angela: Hmm, I hadn't thought about it like that. So what else are DEFRA's models actually missing? Because it sounds like there's quite a lot. Asad: There is. So the — well, the official figures use something called the Impact Pathway Approach, which is solid, but it's deliberately narrow. First big gap: cognitive and mental health impacts. Emerging research links PM2.5 exposure to dementia risk, depression, reduced childhood cognitive development. These rarely appear in standard cost models because the causal evidence, while strong, is newer than the cardiovascular and respiratory stuff. Angela: So for a family that could mean... what, a child's test scores being nudged down? Asad: Yeah, or a parent's dementia diagnosis arriving a year or two earlier. Real costs — real human costs — but they're just not in the DEFRA total. Angela: That's... honestly that's a bit scary. Asad: It is. And then there's lost productivity. The CBI has flagged air pollution as a workforce issue. Missed work, reduced output on high-pollution days, higher staff turnover in polluted areas. For households that translates to higher sickness absence, increased carer leave for kids with asthma flare-ups, even higher private health insurance premiums in affected areas. Angela: Oh! So my health insurance could literally cost more because of my postcode's air quality? Asad: It's starting to go that way, yeah. Insurers are slowly factoring local air quality into their risk models. And then there's the adaptation costs — once you know your air is

Episode Notes & Resources

v

Full Written Guide: UK Air Quality and Health Costs: DEFRA vs WHO Mistakes, Hidden Bills and Smarter Choices

This podcast episode is based on the companion article for deeper context and references.

Read the full written guide: UK Air Quality and Health Costs: DEFRA vs WHO Mistakes, Hidden Bills and Smarter Choices

Tools Mentioned in This Episode

Related blogs

FAQ

Q: What is this episode about?

A: This episode covers: air quality costs, household budget. It explains the most practical ideas first, highlights common mistakes, and gives clear next steps you can apply to your own situation without needing specialist knowledge.

Q: How long is this episode?

A: This episode is approximately 16:02. You can use key moments to jump directly to sections, revisit the parts that matter most to you, and turn the guidance into a short action list after listening.

Q: Can I read this instead?

A: Yes. Check the "Related blog article" section for the full written version with links and references. The written format is useful if you prefer scanning, comparing options line by line, or sharing specific points with family members.

Q: Can I listen on other platforms?

A: Yes. Use Spotify, Apple Podcasts, Amazon Music, and YouTube links on this page when available. Platform availability can vary by processing time, so if one link is delayed, the web player and companion blog still provide full access.

Q: What other topics are covered?

A: defra vs who, indoor air pollution, health impacts. These are connected to the main discussion so you can understand trade-offs, avoid one-sided decisions, and choose actions that are realistic for your budget and timeline.

Q: Which tools should I use after listening?

A: Start with: UK Budget & Income Planner, Home Buying Affordability Calculator, UK Help-to-Buy Equity Loan Repayment Calculator (2026). You can find them in the Related tools section below. A good approach is to run one baseline scenario first, then test two or three alternatives so your final decision is based on numbers, not guesswork.

Q: Are there related blogs I can read next?

A: Yes. This episode links to 5 related blog articles for deeper context. Reading one follow-up article is often enough to clarify assumptions and help you build a practical weekly or monthly plan.

Topics covered

air quality costshousehold budgetdefra vs whoindoor air pollutionhealth impactspersonal exposureproperty valuecommute choicesair quality toolscost saving tips

Explore these topics

Pick a topic tag below, then use the quick actions once to browse matching blogs or episodes.